AG Grid 36 introduces calculated columns
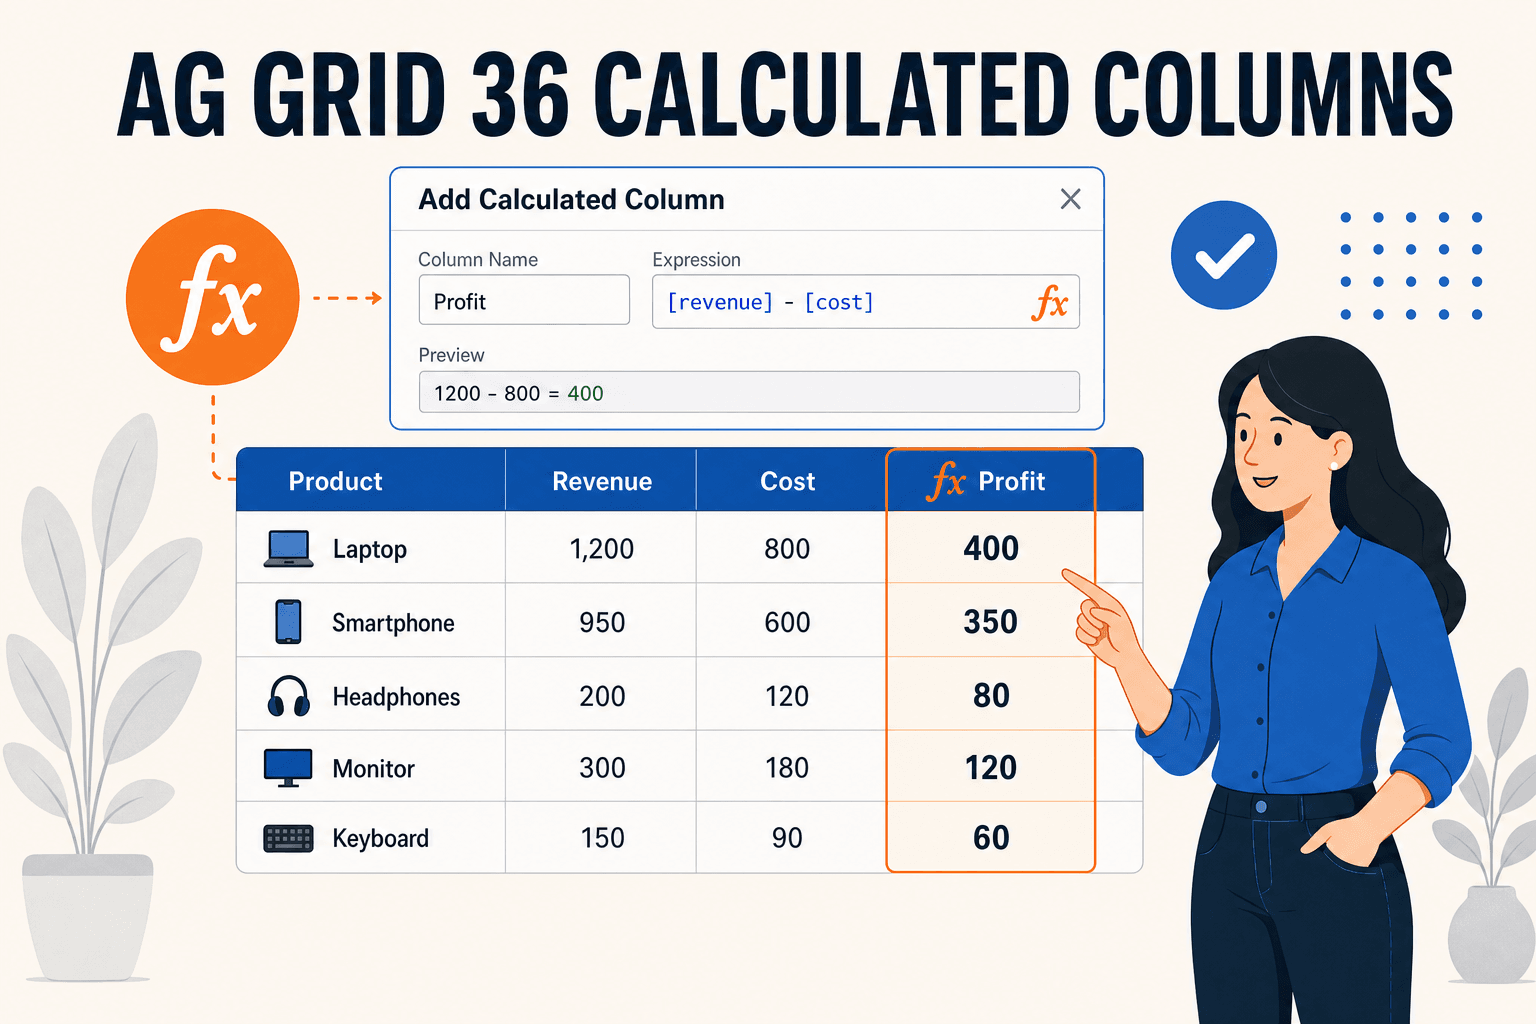
AG Grid 36 adds calculated columns — derive new columns from formula expressions without touching your data source, complete with a built-in UI for end users. We look at how it works, with running examples.
AG Grid 36 introduces calculated columns#
AG Grid 36, released in June 2026, ships with its flagship feature of the year: calculated columns. You can now define entire columns from formula expressions — like — without modifying the underlying data source. Developers can configure them up front in the column definitions, and end users can create their own directly in the grid through a built-in dialog. In this article we walk through the feature with running examples.
[revenue] - [cost]TL;DR
Set on the grid and add a to a column definition to derive its values from other columns in the same row. Expressions support column references (), functions (, , ...) and operators, and can reference other calculated columns. End users can add, edit and remove calculated columns via the column header menu — no code required. Calculated columns behave like regular columns: sorting, filtering, grouping and pivoting all work.
calculatedColumns: truecalculatedExpression[revenue]IFROUNDFrom formulas to calculated columns#
If this sounds familiar, it's because AG Grid 35 introduced spreadsheet-style formulas in cells back in December 2025. Formulas let users type expressions into individual cells, with cell references like and .
A1B2:C5Calculated columns build on the same formula engine, but move up one level of abstraction: instead of a formula living in a single cell, the expression defines every cell of a whole column. References are by column — resolves to the same-row value of the column with that — so the expression reads naturally and applies uniformly to all rows.
[revenue]colIdThis is the classic "derived column" use case: profit from revenue and cost, margin from profit and revenue, a status flag from a threshold. Until now you'd implement these with a in code; with AG Grid 36, they're a declarative one-liner — and end users can create them too.
valueGetterEnabling calculated columns#
Two things are needed:
- Set the grid option to
calculatedColumns.true - Add a to a column definition. Application-declared calculated columns must define an explicit
calculatedExpression.colId
const columnDefs = [
  { field: "revenue" },
  { field: "cost" },
  {
    colId: "profit",
    headerName: "Profit",
    calculatedExpression: "[revenue] - [cost]",
    cellDataType: "number",
  },
];

<AgGridReact columnDefs={columnDefs} rowData={rowData} calculatedColumns />;
COPY
Here it is running — the and columns are editable, so change a value and watch the column recalculate:
revenuecostProfit A basic calculated column in AG Grid 36
View Mode
Fork Forkimport { AgGridReact } from "ag-grid-react"; import { AllEnterpriseModule, ColDef, ModuleRegistry, ValueFormatterParams, themeQuartz, colorSchemeDark, } from "ag-grid-enterprise"; ModuleRegistry.registerModules([AllEnterpriseModule]); type ProductSale = { product: string; revenue: number; cost: number; }; const data: ProductSale[] = [ { product: "Solar panel kit", revenue: 142000, cost: 96000 }, { product: "Smart thermostat", revenue: 78000, cost: 52000 }, { product: "Battery pack", revenue: 126000, cost: 101000 }, { product: "EV charger", revenue: 92000, cost: 61000 }, { product: "Heat pump", revenue: 168000, cost: 119000 }, { product: "Inverter unit", revenue: 88000, cost: 57000 }, { product: "Wind turbine kit", revenue: 232000, cost: 171000 }, { product: "Solar tile roof", revenue: 198000, cost: 144000 }, { product: "Power optimiser", revenue: 64000, cost: 41000 }, { product: "Charge controller", revenue: 53000, cost: 33000 }, { product: "Energy monitor", revenue: 47000, cost: 29000 }, { product: "Backup generator", revenue: 173000, cost: 131000 }, ]; const currencyFormatter = (params: ValueFormatterParams<ProductSale>) => { const { value } = params; if (value == null) { return ""; } // calculated columns render error codes like "#REF!" as string values if (String(value).startsWith("#")) { return String(value); } return `$${Number(value).toLocaleString()}`; }; const columnDefs: ColDef<ProductSale>[] = [ { field: "product", flex: 1.4 }, { field: "revenue", editable: true, valueFormatter: currencyFormatter, }, { field: "cost", editable: true, valueFormatter: currencyFormatter, }, { colId: "profit", headerName: "Profit", calculatedExpression: "[revenue] - [cost]", cellDataType: "number", sortable: true, filter: "agNumberColumnFilter", valueFormatter: currencyFormatter, }, ]; export default function () { return ( <AgGridReact columnDefs={columnDefs} rowData={data} calculatedColumns defaultColDef={{ flex: 1, minWidth: 120 }} theme={themeQuartz.withPart(colorSchemeDark)} /> ); }
Calculated columns are always read-only — they cannot be edited through cell editing, paste, fill handle or delete operations. Invalid expressions render spreadsheet-style error codes (e.g. ) as cell values, which is why the value formatters in these examples pass through values starting with .
#REF!#The built-in UI for end users#
The part that makes this feature stand out is that end users can create calculated columns themselves. With the column menu registered (it's included in the enterprise bundle used by the examples on this page), the header menu shows an Add Calculated Column item, which opens a dialog where users pick a title, a data type and an expression — with pickers and inline autocomplete for columns, functions and operators, plus a live preview of the result.
Try it in any of the examples on this page: open a column header menu and choose Add Calculated Column.
A few things worth knowing about the dialog:
- References are shown by header name (e.g. ), and translated back to stable
[Revenue]references before being stored, so they survive column reorders.colId - By default edits apply live as the user types; set to require an explicit Apply click, with validation preventing invalid expressions from being applied.
calculatedColumns: { applyMode: 'deferred' } - The dialog manages columns inside the grid without mutating the array you supplied. To persist user-created columns, read the full definitions back with
columnDefs.api.getColumnDefs() - The dialog can be customized: restrict the available data types (), hide expression picker buttons (
dataTypes), or disable the column highlight shown while editing (expressionPickers).suppressColumnHighlighting
Chaining expressions and using functions#
Expressions aren't limited to arithmetic on raw data columns. They support the same operators and built-in functions as AG Grid formulas, and a calculated column can reference other calculated columns in the same row. That enables chained derived values — here feeds , and feeds a text computed with the function:
profitmarginmarginstatusIF Chained calculated columns with functions
View Mode
Fork Forkimport { AgGridReact } from "ag-grid-react"; import { AllEnterpriseModule, ColDef, ModuleRegistry, ValueFormatterParams, themeQuartz, colorSchemeDark, } from "ag-grid-enterprise"; ModuleRegistry.registerModules([AllEnterpriseModule]); type Account = { account: string; revenue: number; cost: number; }; const data: Account[] = [ { account: "Northwind Energy", revenue: 245000, cost: 172000 }, { account: "Summit Retail", revenue: 186000, cost: 151000 }, { account: "Pioneer Logistics", revenue: 214000, cost: 139000 }, { account: "Apex Manufacturing", revenue: 198000, cost: 158000 }, { account: "Blue River Telecom", revenue: 276000, cost: 192000 }, { account: "Crestline Foods", revenue: 167000, cost: 121000 }, { account: "Harbor Freight Co", revenue: 142000, cost: 99000 }, { account: "Atlas Mining", revenue: 251000, cost: 197000 }, { account: "Quantum Software", revenue: 298000, cost: 176000 }, { account: "Ironbridge Steel", revenue: 221000, cost: 183000 }, { account: "Meridian Airlines", revenue: 312000, cost: 268000 }, { account: "Silverline Bank", revenue: 265000, cost: 191000 }, ]; const formatter = ( params: ValueFormatterParams<Account>, formatted: string ) => { const { value } = params; if (value == null) { return ""; } if (String(value).startsWith("#")) { return String(value); } return formatted; }; const currencyFormatter = (params: ValueFormatterParams<Account>) => formatter(params, `$${Number(params.value ?? 0).toLocaleString()}`); const percentageFormatter = (params: ValueFormatterParams<Account>) => formatter(params, `${Math.round(Number(params.value ?? 0) * 100)}%`); const columnDefs: ColDef<Account>[] = [ { field: "account", flex: 1.4 }, { field: "revenue", valueFormatter: currencyFormatter }, { field: "cost", valueFormatter: currencyFormatter }, { colId: "profit", headerName: "Profit", calculatedExpression: "[revenue] - [cost]", cellDataType: "number", valueFormatter: currencyFormatter, }, { // references another calculated column colId: "margin", headerName: "Margin", calculatedExpression: "[profit] / [revenue]", cellDataType: "number", valueFormatter: percentageFormatter, }, { // functions work too colId: "status", headerName: "Status", calculatedExpression: 'IF([margin] >= 0.25, "Healthy", "Review")', cellDataType: "text", }, ]; export default function () { return ( <AgGridReact columnDefs={columnDefs} rowData={data} calculatedColumns defaultColDef={{ flex: 1, minWidth: 120 }} theme={themeQuartz.withPart(colorSchemeDark)} /> ); }
Note the column: produces a text value, and since calculated columns are full columns, you can sort and filter by it like any other column.
statusIF([margin] >= 0.25, "Healthy", "Review")Row grouping and aggregation#
Calculated columns evaluate on rows that have their own data — leaf rows. Group rows don't have data, so a calculated column stays blank on them unless you give it an : each leaf evaluates the expression, and the group aggregates the per-leaf results, exactly like a column with a .
aggFuncvalueGetterIn the example below, has so groups show total profit, while (a ratio, which has no meaningful sum) has no and stays blank on group rows:
ProfitaggFunc: "sum"MarginaggFunc Calculated columns with row grouping
View Mode
Fork Forkimport { AgGridReact } from "ag-grid-react"; import { AllEnterpriseModule, ColDef, ModuleRegistry, ValueFormatterParams, themeQuartz, colorSchemeDark, } from "ag-grid-enterprise"; ModuleRegistry.registerModules([AllEnterpriseModule]); type ProductSale = { productType: string; product: string; revenue: number; cost: number; }; const data: ProductSale[] = [ { productType: "Solar", product: "Solar panel kit", revenue: 142000, cost: 96000 }, { productType: "Solar", product: "Solar tile roof", revenue: 198000, cost: 144000 }, { productType: "Solar", product: "Solar pump", revenue: 67000, cost: 45000 }, { productType: "Charging", product: "Battery pack", revenue: 126000, cost: 101000 }, { productType: "Charging", product: "EV charger", revenue: 92000, cost: 61000 }, { productType: "Charging", product: "Charge controller", revenue: 53000, cost: 33000 }, { productType: "Heating", product: "Heat pump", revenue: 168000, cost: 119000 }, { productType: "Heating", product: "Hybrid boiler", revenue: 156000, cost: 117000 }, { productType: "Heating", product: "Heat recovery unit", revenue: 124000, cost: 88000 }, { productType: "Wind", product: "Wind turbine kit", revenue: 232000, cost: 171000 }, { productType: "Wind", product: "Micro turbine", revenue: 76000, cost: 49000 }, { productType: "Monitoring", product: "Energy monitor", revenue: 47000, cost: 29000 }, { productType: "Monitoring", product: "Smart meter", revenue: 39000, cost: 24000 }, ]; const formatter = ( params: ValueFormatterParams<ProductSale>, formatted: string ) => { const { value } = params; if (value == null) { return ""; } if (String(value).startsWith("#")) { return String(value); } return formatted; }; const currencyFormatter = (params: ValueFormatterParams<ProductSale>) => formatter(params, `$${Number(params.value ?? 0).toLocaleString()}`); const percentageFormatter = (params: ValueFormatterParams<ProductSale>) => formatter(params, `${Math.round(Number(params.value ?? 0) * 100)}%`); const columnDefs: ColDef<ProductSale>[] = [ { field: "productType", rowGroup: true, hide: true }, { field: "product", flex: 1.4 }, { field: "revenue", aggFunc: "sum", valueFormatter: currencyFormatter }, { field: "cost", aggFunc: "sum", valueFormatter: currencyFormatter }, { colId: "profit", headerName: "Profit", calculatedExpression: "[revenue] - [cost]", // aggFunc aggregates the per-leaf results onto group rows aggFunc: "sum", cellDataType: "number", valueFormatter: currencyFormatter, }, { colId: "margin", headerName: "Margin", // no aggFunc: a ratio does not aggregate, so group rows stay blank calculatedExpression: "[profit] / [revenue]", cellDataType: "number", valueFormatter: percentageFormatter, }, ]; export default function () { return ( <AgGridReact columnDefs={columnDefs} rowData={data} calculatedColumns defaultColDef={{ flex: 1, minWidth: 120 }} autoGroupColumnDef={{ headerName: "Product Type", minWidth: 180 }} groupDefaultExpanded={-1} theme={themeQuartz.withPart(colorSchemeDark)} /> ); }
The same rules extend to pivoting: a calculated column with an acts as a value column, and one with can even serve as the pivot key.
aggFuncpivot: trueManaging calculated columns via the API#
There's no separate calculated-columns API — they're managed through column definitions like any other column:
// read the current definitions (including user-created calculated columns)
const colDefs = api.getColumnDefs() ?? [];

// add a calculated column
api.setGridOption("columnDefs", [
  ...colDefs,
  {
    colId: "profitMargin",
    headerName: "Profit Margin",
    calculatedExpression: "([revenue] - [cost]) / [revenue]",
    cellDataType: "number",
  },
]);
COPY
The grid also fires dedicated events — , , and — useful for persisting user-created columns or reacting to invalid expressions.
calculatedColumnCreatedcalculatedColumnExpressionChangedcalculatedColumnRemovedcalculatedColumnValidationStateChangedCaveats and limitations#
- Enterprise only — calculated columns live in the of
CalculatedColumnsModule(about 58 KB gzipped as a standalone module).ag-grid-enterprise - Read-only — calculated cells cannot be edited, pasted into, or cleared.
- Row model caveats — same-row references work with all row models, but with the server-side, infinite and viewport row models the grid does not client-sort or client-filter by calculated results; that remains a datasource/server responsibility.
- Explicit required — for calculated columns declared in code.
colId
How this fits in the DataGrid landscape#
Derived values in DataGrids have traditionally been a developer concern: functions in AG Grid, / in MUI X DataGrid, accessor functions in TanStack Table, on columns in Infinite Table. What's new in AG Grid 36 is pushing this capability to end users, with a spreadsheet-style expression language and a built-in editing UI — very few grids offer anything comparable out of the box.
valueGettervalueGettervalueFormattervalueGetterIf your users keep asking for "just one more computed column", this feature can eliminate a whole class of change requests. For a broader look at how the popular grids compare, see AG Grid vs Infinite Table vs MUI X DataGrid vs TanStack Table (2025) and Which is the best datagrid?.
Summary#
Calculated columns are the headline feature of AG Grid 36, and deservedly so: a declarative on the column definition gives you derived columns without touching your data source, expressions can chain and use functions, grouping and pivoting work as expected, and the built-in dialog lets end users create their own columns without code. If you're on AG Grid Enterprise, this is one of the most impactful upgrades in recent releases — the running examples above are a good place to start experimenting.
calculatedExpressionFor more content like this, follow us on at @thedatagrid